
Your Year, Wrapped

Data analyst
Scroll to begin
Chapter 01 - The numbers
Chapter 02 - Top tracks
Chapter 03 - Most-played project
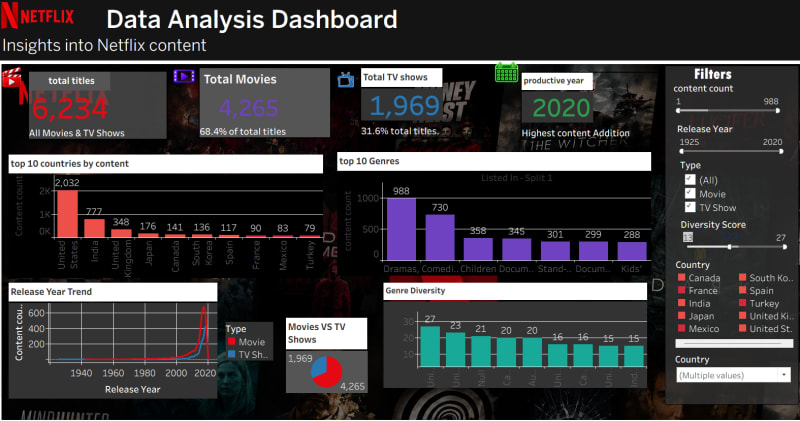
Exploratory Data Analysis on Netflix dataset unlocks content trends, guiding recommendation engines. Built with Python, pandas, seaborn, and Jupyter, it automates feature extraction and visual storytelling.
Chapter 04 - The tour
Teck trek
Chapter 06 - The receipts
Conputer Student — Benha National university
Data science
Chapter 07 - Off the record
Crunching numbers feels like detective work—every dataset hides a story I’m eager to uncover.
I build data pipelines in Python and SQL, orchestrate ETL with Airflow, and model insights in Pandas and PySpark. I translate raw logs into interactive dashboards using Looker and Tableau, then turn those visuals into actionable reports for stakeholders. I write unit‑tested, maintainable code, enforce schema validation, and push performance gains of 30%+ with caching and vectorized queries. I also deploy models to SageMaker, monitor drift, and iterate quickly.
Now I’m hunting opportunities that blend data strategy with software delivery—where I can architect end‑to‑end solutions that scale, delight users, and lead cross‑functional squads in agile sprints.
That's a wrap.

Eman Nabil. Reach out, or share this story.
Built with Portify